We at Tips On Share Blogspot provides free stock tips on US stock market like NASDAQ, Dow Jones, S&P 500 and Indian Stock Market. Free Intraday tips Stock tips and share price chart on almost every stocks of India and on New York stock exchange. We daily update Stock Tips with the help of Technical Analysis. We also provide technical analysis chart on Forex, Indian currency, mcx, ncdex and us stock market listed companies and Companies of India with outlook for today and tomorrow.
MCX copper finding strong 38.2% fibonacci retracement resistance at current levels, chart indicates further price rise can be seen once it closes and holds above 365.
Copper also holding above 20 DMA, this indicates bulls will be favored. Close Watch.
Aluminium closed below its golden ratio support zone @ 112, chart indicates bears will be favored as long as it holds below 112, if falls further then it will find next strong support around 109. Close Watch.
Currency USDINR currently finding strong fibonacci retracement resistance at current level, technical indicates close watch for resistance levels mention above.
We can see some bullish action once stock closes and holds above.
Stock currently coming down from resistance zone @ 313, technical indicates as long as SBI holds above below 313 bears will be favored. Further price rise can be seen once stock closes and holds above 313.
Stock closed above its golden ratio, further price rise can be seen as long as it holds above 62.25, upper side will now find strong resistance around 67 its previous top.
Stock moving up from strong support, close watch Reliance Infra will now be finding strong resistance around 476 (as shown above). Further price rise can be seen once stock closes and holds above.
Stock currently witnessing selling pressure from golden ratio @ 77.50, chart indicates as long as it holds below further weakness can be seen. On down side will find strong support around 66.50.
Stock coming down from strong golden ratio resistance around 474.50. Chart indicates further price rise can be seen in Reliance Capital once it closes and holds above 474.50.
Stock currently coming down from 38.2% fibonacci retracement resistance zone, chart indicates as long as it holds below further price fall can be seen in coming days.
On down side ICICI Bank will find strong support around 316.50 its recent bottom.
DLF moving up from 50 days moving average and golden ratio support zone @ 148, chart indicates as long as stock holds above bulls will be favored and further price rise can be seen in coming days.
Weakness expecting once DLF closes and holds below 148. Close Watch.
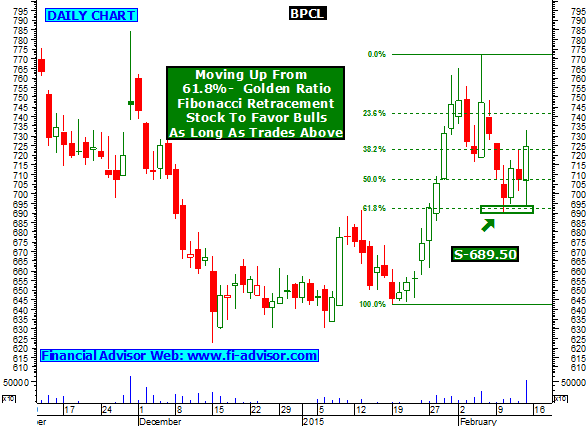
Stock moving up from strong golden ratio support zone as shown above, this indicates as long as BPCL holds above 689.50 bulls will be favored and further price rise can be seen.
We can see some weakness in BPCL once stock closes and holds below 689.50. Close Watch.
Stock finding strong support around 176.50, chart indicates further price fall can be seen once Apollo tyres closes and starts trading below 176.50. Close Watch.
Q. What is Intraday Tips / Inraday Trading / Delivery trading.
A. There are basically two types of trading on stock market-- 1- Delivery 2- Intraday
Delivery trading is one in which shares are bought and can only be sold after they are delivered by the broker.that means that they cannot be sold the same day , and delivery takes two to three days after they are bought and then they are ready to be sold.
Intraday trading which takes place for that very particular day and there is no delivery..they can be bought and sold the same day...and are automatically sold at the end of the trading session if you have not sold it by yourself during the trading session. The person who suggest such types of forecast is called